

Devstars
Blog
Date: 07/09/2026
Stuart WatkinsBots now account for 59.1% of the web page traffic Cloudflare sees worldwide. Not a third, which is the figure everyone repeats. Nearly six in ten. That’s for the three months to 7 September 2026, counting actual web pages rather than every file a browser loads along the way. The gap between those two numbers is the whole story.
Much of our focus these days is understanding the numbers behind web visits so this sort of things can start raising alarm bells.
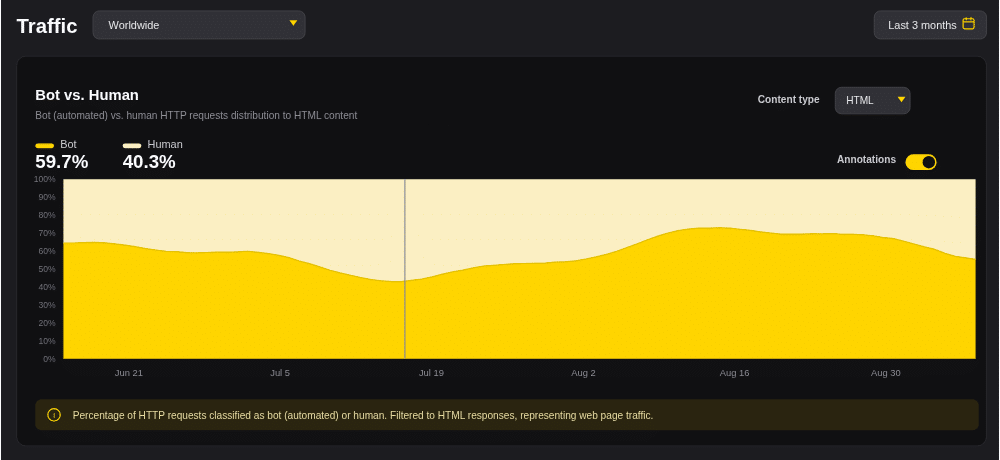
When I read that bot traffic had overtaken human traffic across the billions of sites Cloudflare monitors, I had to do some diffing. Cloudflare’s own headline figure is about 35%. Big, but nowhere near a majority.
So I went digging, fully intending to write a piece about how everyone was overstating it.
Pulled the country data, pulled the regional data, built the case. Then I found a dropdown menu I’d been ignoring, and the whole argument fell over.
Anyway. Here’s what I got wrong:
The thing is, none of this makes sense until you know what’s being counted. And it isn’t visits.
When someone lands on one of your pages, their browser doesn’t fetch one thing. It fetches the page, then the logo, then eight product photos, then the stylesheet, then four font files, then whatever tracking scripts you’ve got running. Every one of those is a separate request.
So one human visitor might generate fifty requests.
A crawler turning up to read that same page usually grabs one. It wants the words. It doesn’t need your fonts.
Now you can see the problem. Count every request and humans look busy, because they’re dragging all those images and scripts along behind them. Count web pages only and you’re comparing like with like.
Cloudflare lets you switch between the two. That’s the dropdown I’d been ignoring.
Here’s what happens when you flip that switch.
| Where | Bots’ share of every request (pages, images, scripts, fonts) | Bots’ share of web pages only |
|---|---|---|
| North America | 46% | 69.7% |
| Europe | not pulled | 60.8% |
| Worldwide | 35% | 59.1% |
| Asia | 26.7% | 48.8% |
| United Kingdom | 24.25% | 41.2% |
| Jersey | 12.26% | 28.6% |
Both columns show what proportion of traffic came from bots rather than people. Cloudflare Radar, three months to 7 September 2026. Devstars analysis.
Between one and a half and two and a half times higher, depending where you look.
So on actual pages, worldwide, machines are already the majority reader. Roughly three to two.
The claim was right. I was measuring the wrong thing. And so is most of the commentary arguing about this, in both directions.
Worth pulling these two apart, because they get used interchangeably and they shouldn’t be.
Europe runs at 60.8% bots on web pages. The UK runs at 41.2%.
Twenty points apart. Opposite sides of the halfway line.
So in the UK, humans are still the majority reader at 58.8%. Across Europe as a whole, they’re not.
Which matters if you’re building a budget case. “Most of our traffic is bots” is a very different conversation from “four in ten page requests are machines, and rising.” Both point the same direction. Only one of them is true for a British business.
This is the bit that took me longest to work out, and it’s pretty simple once it lands.
These charts don’t measure where people are. They measure where servers are, divided by how many people happen to live there.
Take Asia. It sits at 48.8%, below the global average. Which looks backwards, because Asia contains Singapore and Hong Kong, two of the most bot-heavy places measured anywhere.
The reason is the bottom half of the sum. Asia has billions of people doing ordinary browsing, and that dilutes even the biggest cloud hubs into insignificance. North America has a fraction of the population and a much larger share of the world’s servers.
Bot share is a ratio. Change the number of humans and it moves, without a single extra bot turning up.
Same explanation for the UK. Sixty-eight million people browsing normally, and none of the hosting concentration that Germany, the Netherlands, France and Ireland carry between them.
Now the country-level figures. Important caveat: these are the “every request” measure, so read them against the left-hand column above, not the right.
| Where | Bots’ share of every request | Humans’ share |
|---|---|---|
| Gibraltar | 93.46% | 6.53% |
| Singapore | 78.50% | 21.50% |
| China | 53.85% | 46.15% |
| United States | 49.13% | 50.87% |
| France | 34.08% | 65.92% |
| Iceland | 30.49% | 69.51% |
| Guernsey | 29.69% | 70.31% |
| United Kingdom | 24.25% | 75.75% |
| Jersey | 12.26% | 87.74% |
Cloudflare Radar, all HTTP requests, three months to 7 September 2026. Devstars analysis.
Gibraltar at 93.46% is quite staggering, really. About 34,000 residents, and fewer than seven requests in a hundred come from a human being.
But it fits the rule. Gibraltar has a big online gambling, hosting and registration sector sitting on top of almost no local browsing. Nothing to dilute the machines. Singapore is the default cloud region for the whole of Asia Pacific with a modest population. Iceland is cheap power and data centres against very few people.
Nobody in Gibraltar is browsing from Gibraltar. But racks of servers are nominally in Gibraltar.
Two things about the island numbers.
First, Jersey and Guernsey are nine miles apart, similar populations, similar economies, and Guernsey carries nearly two and a half times the bot share.
Second, look at the Caribbean. Cayman Islands 57.7%, Saint Kitts and Nevis 40.0%, Turks and Caicos 25.3%. Three offshore financial centres sitting exactly where Gibraltar sits in the European data.
You could conclude from that that offshore jurisdictions attract bots. Tidy conclusion, and wrong, because Jersey sits at 12.26%.
The likely explanation is where the infrastructure physically sits rather than what the industry does. Some places host servers and register domains locally at scale. Others run substantial financial services while the compute sits in London, Dublin or Frankfurt.
Jersey’s low figure is a hosting fact, not a compliment. On web pages the island still runs at 28.6% bots, against 41.2% for the UK and 59.1% worldwide. More than one page request in four, right here.
More to the point, it describes traffic leaving the island. The crawlers reading your website arrive from wherever they happen to live.
Look at bot traffic by network rather than by country and it firms up.
Amazon’s two main networks account for around 15% of global bot traffic between them. Microsoft adds 7.7%, Google 7.9% across two networks, Cloudflare itself 4.2%. Then the budget hosts: OVH at 2.5%, Hetzner at 2.2%, DigitalOcean at 1.2%.
I’d expected the cheap dedicated server providers to dominate. They don’t. The hyperscalers do, which suggests more of this is legitimate crawling than the alarming headline implies.
Three caveats before anyone quotes this at a board meeting. This is Cloudflare’s view of a large share of the web, a sample rather than a census. IP geolocation reflects registration, not physical reality, so a bot registered in Germany can be operated from anywhere. And “bot” covers verified crawlers like Googlebot and GPTBot alongside unverified automation of every kind.
If most of the requests hitting your pages are machines, you’ve got a second audience with completely different needs arriving at exactly the same URLs as your customers.
Channel one is the human read. Speed, clarity, a page that makes sense in three seconds, an obvious route to getting in touch. Everybody already thinks about this one.
Channel two is the machine read, and it has two halves pulling in opposite directions.
Keep the bad ones out. Updates applied, plugins current, forms protected, sensible rate limiting, a firewall that knows a crawler from a probe. Unglamorous work. Nobody wins a client by having a patched CMS. But the businesses I see get hurt are almost always running old software and an unprotected contact form.
Let the good ones in, and make it easy. Content that exists before JavaScript runs, clean heading structure, schema markup, no crawler blocks applied by accident. A person will forgive a bit of muddle on your services page. A crawler won’t. If your content only appears after a script executes, some crawlers see a blank page and move on.
That’s a lost enquiry you’ll never see, because it never happened.
This is the part most people stop short of, and it does the heavy lifting.
When somebody asks an AI tool for a recommendation, the answer isn’t assembled from your website alone. It comes from directories, review sites, industry listings, news mentions, LinkedIn, Companies House. Anywhere your business appears.
So your business communications have the same split. Humans read your case studies and your reviews. Machines read your listings, your schema, and the way third parties describe you.
If your address is written three different ways across four directories, that’s a weak signal. If your services page says one thing and your Google Business Profile says another, that’s a contradiction, and contradictions get resolved by picking somebody else.
The job is to make the signals match, then build genuine positive evidence about you on sites you don’t control. Consistent details everywhere. Real reviews. Named people with real credentials. Independent sources describing what you do in terms that line up with how you describe it yourself.
That takes longer than fixing a website. It’s also far harder for a competitor to copy.
None of that needs a developer. All of it can be done in an afternoon.
On web pages rather than raw requests, machines now outnumber people worldwide by roughly three to two, which makes a secure, well-structured site with consistent evidence behind it a commercial matter rather than a technical one.
Next step: run the five checks above this week. If you’d rather somebody looked properly and told you plainly what they found, that’s the work I do, and I’m happy to take a look.
Tell me what you’re trying to fix. Half an hour, no pitch, no slide deck.
If we’re the right fit we’ll talk about what’s next. If we’re not, I’ll point you to someone who is.


